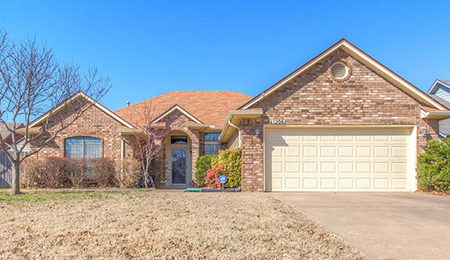
Here is the latest Tulsa market report and what it means for you.
Hey there! I just wanted to share with you all of the great things that are happening in the Tulsa real estate market. We want to be your local real estate economist of choice; we are here, we are knowledgeable, and we are in the market every day. Today I have a market report that’s fresh off the presses from our local multiple listing service. As a team, we are always monitoring and checking this report to see what is happening in the Tulsa market.
This is an amazingly detailed report, and you can find the whole document on this site. We typically like to focus on the year-over-year stats. They are going to be a snapshot of how 2021 compared to 2020. We saw huge increases in a lot of areas and huge decreases in some other areas.
Real estate is always about supply and demand. When we have a low supply of homes for sale, the demand goes up, which also means the values go up. That is definitely what we have seen here over the last year.
The top categories are the number of closed sales, pending sales, and new listings on the market. We had an increase in sales and pendings, but the active new listings are down over the whole year.
A seller can price their home for whatever they like; it just may not sell for that, so we want to see what the reality is of you getting what you priced your home for. The number that tracks that is the average percent of listing price to selling price. It is now at 99.26%, so you can see that people who priced their homes at market value got that price.
The average sales price over these last two years has continued to increase. From 2020 to 2021, there was a 15.9% increase, so while you were sitting in your property, it has appreciated almost 16% by doing nothing. Isn’t that pretty cool?
The other determining factor we like to look at is how long it takes to sell a home. With low supply and high demand, you can imagine that homes not only sell for more money but in a shorter amount of time. In the past, the average was at 33 days on the market, and now it is at 23 days. That is down 27%!
The months’ supply of inventory, or absorption rate, is also really important to note. This compares how long a new home would take to sell with a snapshot of everything available right now. That number is at 1.63 months, so in almost two months, everything that is currently active would sell. That again tells us that there is a huge need for active properties.
With that being said, we’re in a crunch; we need help selling homes to our buyers! We have active buyers looking for properties, but we’ve scoured the market, and all of them are either sold or not on the market yet. Maybe you have a home that you’re thinking about selling, or you might just be curious about your home’s value. We want to be here for you when you have these questions, thoughts, or even an inkling of curiosity. That’s what we’re here for!
Another cool thing about being in contact with us is that we have many agents working with buyers and sellers every day. I shared with you that active inventory is low, but we’ve already met with future sellers who are finishing up some painting or repairs and getting their homes ready for the market. We have an active pipeline of properties coming up, so if you’re interested in getting a report whenever those properties hit the market, we’d be happy to send you those. Just email or message us to get on our hot properties alert list.
Call or email us if you have questions, concerns, ideas, or any real estate needs. We’d love to speak with you!


